U.S. GDP Expenditure Components

One way to decompose the GDP is in terms of its expenditure components, Y ≡ C + I + G + NX. I like to write "≡" instead of "=" to remind myself that this decomposition is measurement, not theory.
 
In what follows, consumption is measured in terms of nondurables and services only--I add consumer durables with private investment. The data is inflation-adjusted, quarterly, and I report year-over-year percent changes. I'll start with recent history (since 2010) and then later look at a longer sample (beginning in 1960).
 
Let me begin with GDP and consumption. I like to study consumption dynamics because I have some notion of Milton Friedman's "permanent income hypothesis" in the back of my mind. The idea is that individuals base their expenditures on nondurable goods and services more on their wealth (a stock) rather on income (a flow)--at least, to the extent they can draw on savings and/or access credit markets. To a first approximation then, one could interpret consumption as the trend for GDP. According to the theory, consumption should respond less strongly to perceived transitory changes in income (GDP) and more strongly to perceive permanent changes in income (GDP). In any case, here's what the data looks like for the U.S. since 2010. 
GDP growth since the end of the Great Recession has averaged about 2%, consumption growth somewhat less. Two things stand out for me. The first is the anemic consumption growth from 2011-early 2014 and in particular 2012-2013. Why were American households so bearish? (Note that the unemployment rate is declining throughout this sample period.) Things seemed to turn around in 2014, but then tailed off somewhat in 2015. Coincidentally (or not), that was the year in which the Fed talked out loud about "lift off" -- raising its policy rate for the first time from 25bp where it had remained since 2009. The second is where we're at now. Yes, GDP growth has rebounded somewhat since early 2016, but we're still well within the bounds of recent history (so, no sign of some impending boom). The tale is told by consumption growth, which has remained steady at about 2%. 
 
The following diagram plots private investment spending, decomposed into residential, non-residential, and consumer durables spending (note that the scales vary across figures).  
The growth rate in consumer durables spending is relatively stable in this sample period, averaging between 5-10%. Residential investment, which collapsed during the Great Recession, did not turn around until late 2011. It has grown as rapidly as 15% in 2012-2013 (the years of anemic consumption growth cited above), but has slowed down markedly since 2016. In terms of non-residential investment, it was surprising (to me) the weakness it displayed, especially in 2016 (this may have been due, at least in part, to the collapse in oil prices, which held back investment in the energy sector.)
Well, here's a picture for you. Government purchases of goods and services actually declined for most of this sample period. (Government investment consists mainly of structures and computer hardware/software (see here) and accounts for about 20% of government purchases.) I've been reflecting a lot on this picture lately because it looks different from what many may think, and also, it looks different from historical behavior (as we'll see below).  
 
For completeness, I include export and import growth. Nothing too interesting here. 
 
What does this same data look like from a longer time perspective? I reproduce the four figures above starting in 1960. 
This is really a striking figure, in my view. There are so many things that catch my eye. The first and most obvious is the decline in volatility beginning around 1985 (this is the so-called Great Moderation). Less obvious, but something worth noting is an apparent growing asymmetry associated with the Great Moderation. In particular, growth recessions seem roughly as severe as they've always been. What's missing are the sharp growth booms. Third, it seems to me that consumption growth was much less volatile than GDP growth prior to 1985. Andrew Spewak and I discuss this here. One possible explanation is that business cycle downturns are generally expected to be much more persistent than in the past (why this might be so would be an interesting question to investigate). Finally, and perhaps most important, economic growth since 2000 has slowed down significantly. St. Louis Fed President Jim Bullard argues we are in a low-growth regime (see here). Is this a recurring phenomenon, as suggested by Schumpeter (see here)? How much of the slowdown is explained by a post WW2 transition dynamic? 
 
Here is private investment spending across categories, 
Again, the Great Moderation is evident, apart from the monumental collapse of residential investment spending in the Great Recession. 
Like private investment, government investment is relatively volatile (though one wonders why this should be the case for government). The most striking aspect of this diagram is the collapse government spending in the immediate aftermath of the Great Recession. One can't help but wonder about the wisdom of such policy during such a period of economic weakness. For those in favor of reducing (G/Y), a more gradual policy would almost surely have been better (e.g., by letting Y grow into G, not by cutting G). 
 
Finally, for completeness, here is export and import growth. 
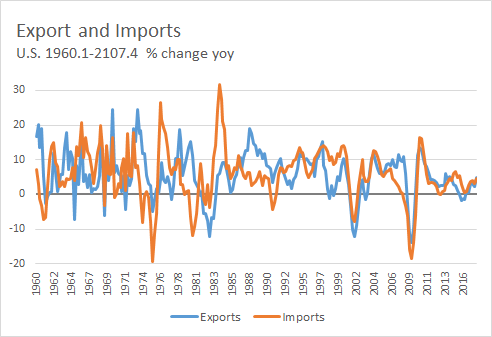
It's interesting that the Great Moderation shows up along this dimension as well.
 
If you have an economic theory that explains all these patterns, I'd be very interested to hear about it below.  

CoinEx Token CET - Ground Floor Profit Opportunity

Bitcoin Cash came into existence on 1 August 2017. We may one day learn who the anonymous miner was who dedicated a significant amount of mining hashrate to make that event possible. However, Haipo Yang, the CEO of ViaBtc must have played a significant role in that event.

ViaBtc originally a miner, added an exchange to their business after BCH launch, but was soon caught up the the big China crackdown. ViaBtc closed their chinese operations in September 2017 and incorporated in the UK as CoinEx in December 2017.

CoinEx started operations in February 2018 and quickly differentiated themselves from all other exchanges by using Bitcoin Cash (BCH) as the base trading pair.

This post is to postulate a potential profit opportunity for investors in their newly issued token CET. 10 billion tokens are on issue. Should anyone invest in this token?

1) Founder - Haipo Yang
    This link shed some light into what makes this guy tick. Most of the other major Chinese exchanges moved their base to Hong Kong, Taiwan, South Korea or Japan. He chose the UK. This is quite a decision and to pivot BCH as the base trading pair is another audacious move.

    If you have followed him and ViaBtc and invested in Bitcoin Cash, you would have profited from that decision. CET is not an ICO token so investing in CET is not investing in CoinEx but it could be the next best thing. Based on what I have seen, Haipo Yang is successful at what he does, thinks outside the square, an put his plans into motion very quickly.

2) Exchange fees.
     CET will have a use case. It can be used to pay trading fees on their CoinEx platform. This immediately gives the token a value. Presumably its' value will increase as the exchange gains in prominence. As an example we can look at another similar token Binance Coin (BNB) This token is used on the Binance exchange, is valued at $9.13 and stands at No 28 in market capitalisation. CET is valued at $0.005. Note however that BNB has only 200 million tokens on issue while CET will have 10 billion.

3) Deflationary plus dividends.
    The equivalent in CET of 20% of CoinEx quarterly profit will be burnt each quarter. This means that they have a policy to distribute 20% of their profits to CET holders every quarter, treating CET holders like shareholders. We wont know how much their profit will be, but Bitfinex is rumoured to make as much a 1 million a day in revenue. Successful exchanges are very profitable.

4) Gas for a decentralised exchange.
     Plans are afoot to use CET as gas in a new decentralised exchange. Most exchanges are rushing to setup decentralised exchanges as exchanges are regularly being hacked. I believe that Bitfinex and Binance have these plans as well.

     An example of a working decentralised exchange is Bitshares. This exchange uses bitshares token as trading fees but is hamstrung because it needed Gateways costing more fees. How CoinEX plans to setup their decentralised exchange is not known but I think that they could very well be first out of the box with a working decentralised exchange.

5) Airdrops through Voting
     One interesting aspect about Coinex is the voting system. You vote for the two coins in each round with native CET tokens. These new listing often come with airdrop 1:1 with CET as only the top 2 coins get listed. EG if Hydro list in a week you get 1000 Hydro for your 1000 CET tokens. If Hydro is priced at $1 on listing then your $.01 ( 1 cent) CET is worth $1.00. Thats 100X in 1 week.
    This is unique to CoinEX and really shows the innovative nature of this company.

6) USDT credit default swap contract
     Essentially you are gambling on the default risk of USDT holders.

2. If you believe there’s a default risk (price drop), you can choose to buy USCB contracts. When a default happens leading to a drop of USDT/USD price e.g. to USDT/USD=0.4, a USCB contract will get 1-USDT/USD=0.6 BTC. 

3. If you don’t believe there’s a default risk (price increase) , you can choose to hold USCA contracts and sell USCB contracts. If no default happens, meaning USDT/USD=1, each USCA contract will bring you 1 BTC and the amount you get from selling USCB is the extra profit. 

7) Other benefits.
     There are other benefits but these are hard to value.

CET tokens just started trading on 11 February. On this basis there should be upward price movements when the coins are useable for trading fees and properly valued after the first quaterly burn.

1 billion CET tokens was distributed free to ViaBtc and CoinEx customers. There would be other "air drops" to selected groups as they are using this strategy to draw customers to their platform. It is not a "moon" coin but the potential for profit exist. This is only my opinion and not investment advise.

Update : As CET tokens are continually being released thus diluting the existing pool, I would update this coin to a Watch. The potential is there but it may take a year or more. 

Use my Referral Link for CoinEx if you wish :
https://www.coinex.com/account/signup?refer_code=sd5fn

Setup MySQL Database for Remote Access

Here are some useful guidelines in setting up a mysql server for remote access in Ubuntu.


  1. Install and configure mysql server.
    sudo apt-get update
    sudo apt-get install mysql-server
    mysql_secure_installation
    *Note in MySQL - it will ask to set the password but not in MariaDB
  2. Bind MySQL to the public IP where it is hosted by editing the file MySQL: /etc/conf/my.cnf or MariaDB: /etc/mysql/mariadb.conf.d/50-server.conf, the cnf file is sometimes pointing to another file - make sure to check that. Search for the line with "bind-address" string. Set the value to your IP address or comment the bind-address line.
  3. Make sure that your user has enough privilege to access the database remotely:
    create user 'lacus'@'localhost' identified by 'lacus';
    grant all privileges on *.* to 'lacus'@'localhost' <with grant option>;
    create user 'lacus'@'%' identified by 'lacus';
    grant all privileges on *.* to 'lacus'@'%' <with grant option>;
  4. Open port: 3306 in the firewall:
    sudo ufw allow 3306/tcp
    sudo service ufw restart

Fiscal theories of the price-level

This post is me thinking out loud about how fiscal considerations may influence the price-level.  The question of what determines the price-level is an old one. It's a question that economists struggle with to this day.

To begin, what do we mean by the price-level? Loosely, the price-level refers to the "cost-of-living," where cost is measured in units of money. Living refers to the flow of services consumed (destroyed) for the purpose of survival/enjoyment. (Note that the cost-of-living might alternatively be measured as the amount of labor one must expend per unit of consumption, but this would require a separate discussion.)

Measuring aggregate material living standards is challenging for two reasons. First, people consume a variety of goods and services. Suppose that the price of food goes up and the price of shelter goes down. Does the cost-of-living go up or down? Second, different people have different material needs/wants (and individual wants and needs change over time too). Statisticians do the best they can to address these complications by constructing "average consumption bundles" as done in the calculation of the Consumer Price Index (CPI). The following diagram plots the change in the price-level (the inflation rate) for several categories of goods and services:


In what follows, I'm going to abstract from inflation and focus only on the theory of the price-level (inflation is the rate of change in the price-level over an extended period of time). To this end, think of a very simple world where the real GDP (y) is fixed and determined exogenously (independent of monetary policy). Assume that the expected rate of inflation is zero. Then, by the Fisher equation, the nominal interest rate corresponds to the real interest rate. I want to think of this interest rate as being potentially influenced by monetary policy (I like to think of r as representing the real yield on treasury debt, where treasury debt possesses a liquidity premium.)

Perhaps the oldest theory of the price-level is the so-called Quantity Theory of Money (QTM). It seems clear enough that people and agencies are willing to accept and hold money because money facilitates transactions--it provides liquidity services. In the simplest version of the QTM, the demand for real money balances takes the form L(y), where L is increasing in y. The idea here is that the demand for liquidity is increasing in the level of aggregate economic activity (as indexed by y).

Next, the QTM assumes that the supply of money (M) is determined by the central bank. Let P denote the price-level. Then (M/P) denotes the supply of real money balances. The QTM asserts that the price-level is determined by an equilibrium condition which equates the supply of real money balances with the demand for real money balances. Mathematically,

[1] M/P = L(y)

Condition [1] can be explained as the consequence of the "hot potato" effect. The idea is that someone must be willing to hold the extant money supply. If M/P > L, then the money supply exceeds money demand. In this case, people will presumably try to dispose of their money holdings (by spending them on goods and services). People accepting money for payment will be thinking the same thing--they are willing to accept the money, but only selling their goods at a higher price. The "hot potato" effect ceases only when condition [1] holds. The same logic applies in reverse when M/P < L (with everyone wanting to get their hands on the potato).

Now, suppose that y varies over time. Then the QTM suggests that a central bank can keep the price-level stable at P0 by letting the money supply move in proportion to money demand; i.e., M = L(y)*P0. This is what is meant by "furbishing an elastic currency." This reminds us as well that interpreting money-price correlations in the data are tricky if money demand is "unstable."

O.K., so now let's see where fiscal policy fits in here. Let D denote the outstanding stock of government debt. If a central bank is restricted to create money only out of government debt, then we can write M = θD, where 0 < θ < 1 is the fraction of the debt monetized by the central bank. If the central bank wants to increase the money supply, it would conduct an "open market operation" in which it buys bonds for newly-issued money, resulting in an increase in θ. Note that the money supply may increase through changes in D for a constant θ.

Let B denote the bonds held by the private sector (i.e., not including the bonds held by the central bank). That is, B = (1 - θ)D. The interest expense of the public debt is given by rB. Note, while the treasury actually pays an interest expense rD, the interest payments to the central bank rM are remitted to the treasury, leaving a net cost equal to rB = r(D-M). Thus, the central bank is in a position to lower the interest expense of the public debt by monetizing a larger fraction of it (I discuss this in more detail here and here.) To the extent that the central bank influences r, it is also in a position to lower the interest expense by lowering r.

Now let's write down the government "budget constraint." Let T denote tax revenue (net of transfers) and let G denote government purchases (of goods and services). Then, assuming that default is not an option, the government budget constraint is given by,

[2] = G + rB

The difference T - G is called the primary budget surplus (deficit, if negative). So another way to read [2] is that the interest expense of the government debt must be financed with a primary surplus. Note that if r < 0, then the government is in a position to run a perpetual primary deficit. (The more general condition is r < g, where g is the growth rate of the economy, which I've normalized here to be zero.)
  
In most monetary models, the fiscal policy plays no role in determining the price-level. The reason for this lies in the implicit assumption that taxes are non-distortionary (e.g., lump-sum) and that the fiscal authority passively adjusts T to ensure that condition [2] holds.  This latter assumption is sometimes labeled a Ricardian fiscal regime. In a Ricardian regime, fiscal policy does not matter for the price-level. To see this, suppose that the central bank increases r. Then the fiscal authority increases T (or decreases G) with no change in the money supply or price-level. Or, imagine that the fiscal authority increases D. In this case, the central bank can keep the money supply constant by lowering θ, the fraction of debt it chooses to monetize. If so, then B will increase. In a Ricardian regime, the fiscal authority will again either increase T (or decrease G), leaving the price-level unchanged. 

But suppose fiscal policy does not behave in the Ricardian manner described above. To take an example, suppose that the fiscal authority instead targets T, or T-G, or (T-G)/P, etc. For concreteness, suppose it targets the real primary surplus τ = (T-G)/P.  In this case, condition [2] can be written as, 

[3] τ = r(B/P)

Condition [3] forms the basis of what is known as the fiscal theory of the price-level (FTPL); see Cochrane (1998). The idea is as follows. Imagine a world where there is no need for money (a cashless economy), so that condition [1] is irrelevant. Imagine too that the real rate of interest is determined by market-forces, so that r > 0 represents the "natural" rate of interest. Finally, imagine that the outstanding stock of debt D = B is nominal. Then the price-level is determined by condition [3] which, while resembling a government budget constraint, is in fact a standard stock-valuation equation. To see this, rewrite [3] as follows,

[4] (B/P) = τ/r

The right-hand-side of [4] represents the present value of a perpetual flow of primary government budget surpluses τ. The left-hand-side of [4] measures the real value of the government's debt. The equation [4] asserts that the real value of government debt is equal to the present value of the stream of primary surpluses. This is analogous to the way one might value the equity of a company that generates a stream of profits τ. 

Note that condition [4] looks a lot like condition [1]. We can use the same "hot potato" analogy to describe the determination of the price-level in this case. For example, suppose that (B/P) > τ/r. Then people and agencies will presumably want to sell the over-valued government debt (for goods and services). People are willing to accept these nominal claims, but only if they are sold more cheaply--that is, if the goods sold to acquire the bonds can be sold at a higher price. As before, this hot potato effect ceases only when condition [4] holds. 

I'm still not sure what to think about the FTPL. While I lean more toward the QTM view, I do believe that fiscal considerations can have an important influence on the price-level. The way I'm inclined to think about this, however, is as follows. 

Since nominal government debt represent claims against government money, it's not surprising that such debt inherits a degree of "moneyness." To the extent this is true, the measure of money M used in equation [1] should be expanded to include the liquid component of government debt. Let X < B denote the liquid component of government debt. There are a few ways to think about this. One obvious way is to imagine that the banking sector creates deposit liabilities out of X. Or we could imagine that X is accepted directly as payment for goods and services, at least, for a subset of agencies (China, for example, effectively exports goods and services for X). In any case, the appropriate measure of money is given by M + X. In the limiting case where X = B, the relevant money supply becomes the entire government debt D = M + B, so that condition [1] becomes, 

[5] D/P = L(y)

In a world where government debt becomes increasingly more relevant as an exchange medium than central bank money, control over the money supply is effectively transferred to the fiscal authority.  This is another sense, distinct from the FTPL, in which fiscal policy might influence the price-level. The difference boils down to the source of money demand -- is it primarily liquidity-preference, or is it because money/debt instruments are viewed as tax-backed liabilities?

There is, of course, much that I've left out here.  While the assumed invariance of real economic activity to monetary and fiscal policy is not a bad place to start for the question at hand, it is clearly not a good place to end. As well, the model should be extended to permit sustained inflation. All of this can be easily done and I'll try to come back to it later. 

Something I do not think is critical for the issue at hand is modeling private money creation (beyond the monetization of government debt modeled above). To the extent that banks monetize positive NPV projects, the money they create out of private assets (in the act of lending) creates value that is commensurate with additional liabilities created. In short, accretive share issuances (good bank loans) are not likely to  be dilutive (inflationary). Of course, the same is true of newly-issued government money if the new money is used to finance positive NPV projects (including the employment of labor in cases of severe underemployment). 

On the Uses (and Abuses) of Economath: The Malthusian Models

Many American undergraduates in Economics interested in doing a Ph.D. are surprised to learn that the first year of an Econ Ph.D. feels much more like entering a Ph.D. in solving mathematical models by hand than it does with learning economics. Typically, there is very little reading or writing involved, but loads and loads of fast algebra is required. Why is it like this?

The first reason is that mathematical models are useful! Take the Malthusian Model. All you need is four simple assumptions: (1) that the birth rate is increasing in income, (2) that the death rate is decreasing in income, (3) that income per person is negatively related to population, and (4) the rate of technological growth is slow relative to population growth, and you can explain a lot of world history, and it leads you to the surprising conclusion that income in a Malthusian economy is determined solely by birth and death rate schedules, and is uncorrelated with technology. Using this model, you can explain, for example, why incomes before 1800 were roughly stagnant for centuries despite improving technology (technological advance just resulted in more people; see the graph of income proxied by skeletal heights below). It also predicts why the Neo-Europes -- the US/Australasia/Southern Cone countries are rich -- they were depopulated by disease, and then Europeans moved in with lots of land per person. It is a very simple, and yet powerful, model. And it makes (correct) predictions that many historians (e.g., Kenneth Pomeranz), scientists (e.g., Jared Diamond), and John Bates Clark-caliber economists (see below) get wrong.


A second beneficial reason is signalling. This reason is not to be discounted given the paramount importance of signalling in all walks of life (still not sufficiently appreciated by all labor economists). Smart people do math. Even smarter people do even more complicated-looking math. I gratuitously put a version of the Melitz model in my job market paper, and when I interviewed, someone remarked that I was "really teched up!" Simple models are not something that serious grown-ups partake in. Other social science disciplines have their own versions of peacock feathers. In philosophy, people write in increasingly obtuse terms, using obscure language and jargon, going through enormous effort to use words requiring as many people as possible to consult dictionaries. Unfortunately, the Malthusian model above, while effective in terms of predictive power, is far too simple to play a beneficial signalling role, and as a result would likely have trouble getting published if introduced today. 

A third reason to use math is that it is easy to use math to trick people. Often, if you make your assumptions in plain English, they will sound ridiculous. But if you couch them in terms of equations, integrals, and matrices, they will appear more sophisticated, and the unrealism of the assumptions may not be obvious, even to people with Ph.D.'s from places like Harvard and Stanford, or to editors at top theory journals such as Econometrica. A particularly informative example is the Malthusian model proposed by Acemoglu, Johnson, and Robinson in the 2001 version of their "Reversal of Fortune" paper (model starts on the bottom of page 9). Note that Daron Acemoglu is widely regarded as one of the most brilliant economic theorists of his generation, is a tenured professor of Economics at MIT, was recently the editor of Econometrica (the top theory journal in all of economics), and was also awarded a John Bates Clark medal (the 2nd most prestigious medal in the profession) in large part for his work on this paper (and a closely related paper). Also keep in mind this paper was eventually published in the QJE, the top journal in the field. Very few living economists have a better CV than Daron Acemoglu. Thus, if we want to learn about how economath is used, we'll do best to start by learning from the master himself.

What's interesting about the Acemoglu et al. Malthusian model is that they take the same basic assumptions, assign a particular functional form to how population growth is influenced by income, and arrive at the conclusion that population density (which is proportional to technology) will be proportional to income! They use the model:

p(t+1) = rho*p(t) + lambda*(y-ybar) + epsilon(t),

where p(t+1) is population density at time t+1, p(t) is population at time t, rho is a parameter (perhaps just less than 1), lambda is a parameter, y is income, ybar is the level of Malthusian subsistence income, and epsilon is an error term. If you impose a steady state (p* and y*) and solve for p*, you get:

p* = 1/(1-rho)*lambda(y*-ybar)

I.e., you get that population density is increasing in income, and thus that income per person should have been increasing throughout history. Thus, these guys from MIT were able to use mathematics and overturn one of the central predictions of the Malthusian model. It is no wonder, then, that Acemoglu was then awarded a Clark medal for this work.

Except. This version doesn't necessarily fit the skeletal evidence above, although that evidence may be incomplete and imperfect (selection issues?). What exactly was the source of the difference in the classical Malthusian model and the "MIT" malthusian model? The crucial assumption, unstated in words but there in greek letters for anyone to see, was that income affects the level of population, but not the growth rate in population. Stated differently, this assumption means that a handful of individuals could and would out-reproduce the whole of China and India combined if they had the same level of income. (With rho less than one, say, .98, the first term will imply a contraction of millions of people in China/India. With income over subsistence, we then need to parameterize lambda to be large enough so that overall population can grow in China. But once we do this, we'll have the implication that even a very small population would have much larger absolute growth than China given the same income.) Obviously, this is quite a ridiculous assumption when stated in plain language. A population can grow by, at most, a few percent per year. 100 people can't have 3 million offspring. What this model does successfully is reveal how cloaking an unrealistic assumption in terms of mathematics can make said assumption very hard to detect, even by tenured economics professors at places like MIT. Math in this case is used as little more than a literary device designed to fool the feebleminded. Fortunately, someone caught the flaw, and this model didn't make the published version in the QJE. Unfortunately, the published version still included the view that population density is a reasonable proxy for income in a Malthusian economy, which of course it is not. And the insight that Malthusian forces led to high incomes in the Neo-Europes was also lost. 

Given that this paper then formed part of the basis of Acemoglu's Clark medal, I think we can safely conclude that people are very susceptible to bullshit when written in equations. More evidence will come later in the comments section, as, conditioned on getting hits, I suspect several people will be taken in by the AJR model, and will defend it vigorously. 

This episodes shows some truth to Bryan Caplan's view that "The main intellectual benefit of studying economath ... is that it allows you to detect the abuse of economath." 

Given the importance of signaling in all walks of life, and given the power of math, not just to illuminate and to signal, but also to trick, confuse, and bewilder, it thus makes perfect sense that roughly 99% of the core training in an economics Ph.D. is in fact in math rather than economics.


Update: Sure enough, as I predicted above, we have a defender of the AJR model in the comments. He argues the AJR model shows why math clarifies, even while his posts unwittingly convey the opposite.

Above, I took issue with the steady state relationship in the model and the fallacious assumption which yields it. The commenter points out correctly, that, outside of the steady state, the AJR model actually implies that there are two conflicting forces. But, so what? My argument was about the steady state. If one fixes the wrong assumption, steady-state income in the Malthusian model will be equal to subsistence income, and thus the main argument for correlation between population density and income outside of the steady state will also be shut down.

Second the commenter unfairly smears Acemoglu & Co., writing that the real problem is not with their model, but that they didn't interpret their model correctly: "goes ahead in the empirical work to largely, in contrast to what their model says, take population density as a proxy for income!".

Thus I'd like to defend Acemoglu against this unfair smear. In preindustrial societies, there were vast differences in population densities between hunter-gatherer groups, and agricultural societies, even though there were not vast income differences between the two. In fact, quite surprisingly, hunter-gatherer societies often look to have been richer despite working less (read Greg Clark), and despite far more primitive technology. Thus it is quite reasonable to assume, as AJR did, that it is likely that differences in technology would swamp the differences in other population shocks (A more important than epsilon). The Black Death might have doubled or tripled incomes, but settled agrarian societies might have population densities 1000 times as large as primitive hunter-gatherer tribes. This isn't an airtight argument, but, given their model, I believe AJR's empirical extension is reasonable, particularly given that they provide a caveat. The problem is that their model is not reasonable.

The commenter goes on to argue that I've gotten AJR's conclusion backward: "You claim that the point they are making is "population density will be a decent proxy for income in a Malthusian model." The point they are making is explicitly the exact opposite: that "caution is required in interpreting population density as a proxy for income per capita." 

Huh? The first two lines of the abstract of the AJR paper read: "Among countries colonized by European powers during the past 500 years, those that were relatively rich in 1500 are now relatively poor. We document this reversal using data on urbanization patterns and population density, which, we argue, proxy for economic prosperity."

Seems clear here they are arguing for using it as a proxy.


Tether In A Bitcoin Bear Market, And Can Tether Be A World Currency?

What is Tether.

Tether is a token issued on the Bitcoin and Ethereum blockchain. and promises to pay out 1 USD for every Tether issued. This led to the community;s concern as to whether the $2 billion in reserve exist. Tether.io did not, could not or would not provide proof of this. News of Tether.io parting company with their auditors made the situation worse.

Lets examine the facts

1)  The price of Tether remained stable throughout this controversy, meaning that even though there was a strong and targeted campaign against it, Tether holders remained steadfast. There was no sell off and the number of Tether issued actually increased. Action speaks louder than words. Therefore we have to conclude that Tether must have an important role in the Crypto economy.

2) One year ago the daily volume of Tether traded was about a million dollars. Today it is 3.5 billion dollars. This is a phenomenal increase. Something is happening.

3) There were claims that Tether was issued to prop up the price of BTC. This can't be true because the price of BTC is down in spite of the increasing number of Tether issued.

Like it or not, Tether is now a huge part of the Crypto economy. It is already second behind BTC in trading volume. ( Adjusted : BTC 6.5 Tether 3.5 billion ) I have no doubt that Tether will surpass BTC in trading volume soon, especially with BTC losing utility and usage daily.

A "Reserve Bank" For Crypto

Does Tether.io have 2.2 billion USD deposited and/or in assets as they claimed? It is dangerous for Tether to reveal their fiat holdings as these can be subjected to confiscation. More than likely if it exists they will mostly be in accounts not directly attributable to them.

They could be held in pledges and guarantees in fiat or assets. However this is done, all that is necessary is for their holders to believe that they can have their Tokens converted to USD on demand as promised. This really makes Tether.io for all intent and purposes "A Bank". It exist because we believe it is solvent. If not there would have been a huge "run on the bank".

This means that USDT can be just printed into existence by Tether.io at whim. We have no way of knowing if they have the full reserve backing for every Tether they issue. What this means is that Tether is now basically backed by the full faith and trust of the Crypto community. This is the reality. If this is not true Tether will not exist, as they have not or cannot prove that they have full reserves. They only have their promise to convert Tether tokens on demand.

It is possible that the number of Tethers issued follows demand, so that its' value always remain at approximately 1 USD. If the units of Tether issued was fixed then demand would have push the price upwards. There must be some mechanism that is keeping the price of Tether stable. Perhaps it is the belief that there is 1 USD backing every Tether issued.

Now comes an interesting thought. What if the whole world starts pricing everything is Tether. Initially we will view Tether the same as 1 USD, but over time Tether may be deemed to be  the stable unit of monetary value and the USD gets to be priced in Tether, together with every other world fiat currency. If this happens, Tether becomes a world currency! This is not so far fetched as how we view money is a generational thing. The younger generation have more faith in the Crypto economy because they are basically excluded from the legacy economy.

Is Tether a huge risk to the Crypto economy? Will Tether crash to zero?

The whole crypto market is crashing. The only Token increasing in market capitalisation is Tether. Based on this it is unlikely that Tether will crash ahead of other tokens. More than likely it is actually underpinning the whole crypto economy.

Can a government shut Tether.io down? The Chinese government is already clamping down on anything crypto. The currency most at risk is the USD. I really have no clue. If the US government could shut down Tether's accounts, I am sure that they would. All that is needed for crypto to survive is for one country to legalise it and Japan has.

We will have to watch this play out, but the bigger the market cap of Tether the harder it will be to shut it down. The value of a token is in the minds of the people using it, and Tether may actually get the full appreciation, support and protection of the whole crypto community.

Tether is not a threat to the crypto economy. It is a stable unit of measure for the crypto economy.  Even the legacy economy does not have this stable unit of measure. Hopefully a system of decentralised governance for Tether may evolve.

Tether in a bear market

Having seen so many boom and bust cycles in the Bitcoin space I have come to appreciate the value of a stable coin like Tether. A market indexed to BTC rises and crashes with the price of BTC. When the market is index to Tether, each coin will rise and fall on its' own merit.

Current demand for Tethers is fuelled by investors wanting a stable unit to hold value while the crypto market is falling. These investors have not cashed out. Perhaps they are looking to buy back in when they belief the market have bottomed out. Perhaps its' arbitrage value is significant. Maybe it will be a hedge against inflating fiat currencies. Time will tell.

Questions Questions and more Questions.

a) What happens when the market turns bullish again? Will supply and demand for Tethers still be kept in equilibrium?

b) Who is the counter party for Tether is a bear market?

c) Will unscrupulous parties print Tethers out of thin air to manipulate the market?

d) Can Tether become a world currency?

Update 10/2/2018

Another interesting observation on Tether is that its' trading volume is equal to its' market cap at the moment. Meaning that the trading volume is at least 1X the number of coins issued. All other coins trade at only a percentage to its' market cap eg Bitcoin at 0.05X. (1/20th) If this observation holds then Tether will have the highest trading volume if its' Market Cap reaches 8 Billion or with the issue of anoher 6 Billion coins.

Tether is an interesting development as it really can be the glue that connects the whole crypto market. It is an issued token so it is not subjected to mining. It is built on the Bitcoin blockchain as a second layer and is therefore secured by the Bitcoin blockchain. Compared to all the other wannabe stable coins, Tether has achieved the network effect.

It has a very interesting use case in that centralised exchanges uses it to offload most of their KYC AML requirements to Tether.io.

Its' function as in intermediary coin between those who believe that the market is rising and those that believe that the market is falling in any particular coin can only gain more usage and prominence.

Another feature is that it trades in a small price band of +/- 10%. This could be deliberate in the sense that more Tethers will be issued if the price trades above 1 USD and redeemed f it trades below. It now makes it possible for risk adverse traders to enter the market knowing that there is a floor bottom for the price of Tethers. This will bring more liquidity to the whole crypto market.

The Tether database is under reconstruction at the moment, perhaps due to the recent 30 million hack. Even with this negative news the price of Tether did not tank, and Tether continues to trade on the exchanges.

Pushing the virtues of Tether does not mean that I am pro Tether against all the other coins. In fact it means that I am pro Crypto. Tether being a stable coin allows all other coins to rise and fall on their own merits against it. This makes it somewhat like Shapeshift.

Can you see where this is leading? If Tether wallet becomes a spending wallet, it means that you can spend whatever coins you have in Tether on the fly. Merchants need only worry about one currency Tether, and for he moment it is equivalent to USD.

There is no mental gymnastics required to convert between Bitcoin or Ethereum or Litecoin or whatever coin when spending or receiving Crypto. The decision to use or hold any particular crypto or fiat comes before or after the Tether transaction by both parties if needed.

This reasoning taken to the extreme may mean that we could easily drop the USD equivalent. It could just become a stable Tether in its' own right. Can this happen/ I think yes. Will it happen? This is hard to predict.

Tether's advantage here is that it has achieve the most network effect as a stable coin. It is neutral. No one holds Tether expecting the coin to "go to the moon" so to speak. That aside, if Tether.io ever goes for an ICO, their tokens will be a very good buy.

There has been much controversy about the connection between Bitfinex and Tether. I do not know much about the politics in this relationship but I think that it has been positive for Bitfinex and probably all exchanges that uses Tether without dealing in fiat. I hear from a reliable source that Bitfinex is giving out a $1.01 dividend in its' 3rd quarter. That is 100% its' share value and comes after 2 previous dividend issue of  25 cents and 37.5 cents respectively. Without a doubt Tether provides liquidity to the Crypto market and more Tether can only mean a stronger Crypto industry.


Progressing from tech to leadership


I've been a technical person all my life. I started doing vulnerability research in the late 1990s - and even today, when I'm not fiddling with CNC-machined robots or making furniture, I'm probably clobbering together a fuzzer or writing a book about browser protocols and APIs. In other words, I'm a geek at heart.


My career is a different story. Over the past two decades and a change, I went from writing CGI scripts and setting up WAN routers for a chain of shopping malls, to doing pentests for institutional customers, to designing a series of network monitoring platforms and handling incident response for a big telco, to building and running the product security org for one of the largest companies in the world. It's been an interesting ride - and now that I'm on the hook for the well-being of about 100 folks across more than a dozen subteams around the world, I've been thinking a bit about the lessons learned along the way.


Of course, I'm a bit hesitant to write such a post: sometimes, your efforts pan out not because of your approach, but despite it - and it's possible to draw precisely the wrong conclusions from such anecdotes. Still, I'm very proud of the culture we've created and the caliber of folks working on our team. It happened through the work of quite a few talented tech leads and managers even before my time, but it did not happen by accident - so I figured that my observations may be useful for some, as long as they are taken with a grain of salt.


But first, let me start on a somewhat somber note: what nobody tells you is that one's level on the leadership ladder tends to be inversely correlated with several measures of happiness. The reason is fairly simple: as you get more senior, a growing number of people will come to you expecting you to solve increasingly fuzzy and challenging problems - and you will no longer be patted on the back for doing so. This should not scare you away from such opportunities, but it definitely calls for a particular mindset: your motivation must come from within. Look beyond the fight-of-the-day; find satisfaction in seeing how far your teams have come over the years.


With that out of the way, here's a collection of notes, loosely organized into three major themes.


The curse of a techie leader


Perhaps the most interesting observation I have is that for a person coming from a technical background, building a healthy team is first and foremost about the subtle art of letting go.


There is a natural urge to stay involved in any project you've started or helped improve; after all, it's your baby: you're familiar with all the nuts and bolts, and nobody else can do this job as well as you. But as your sphere of influence grows, this becomes a choke point: there are only so many things you could be doing at once. Just as importantly, the project-hoarding behavior robs more junior folks of the ability to take on new responsibilities and bring their own ideas to life. In other words, when done properly, delegation is not just about freeing up your plate; it's also about empowerment and about signalling trust.


Of course, when you hand your project over to somebody else, the new owner will initially be slower and more clumsy than you; but if you pick the new leads wisely, give them the right tools and the right incentives, and don't make them deathly afraid of messing up, they will soon excel at their new jobs - and be grateful for the opportunity.


A related affliction of many accomplished techies is the conviction that they know the answers to every question even tangentially related to their domain of expertise; that belief is coupled with a burning desire to have the last word in every debate. When practiced in moderation, this behavior is fine among peers - but for a leader, one of the most important skills to learn is knowing when to keep your mouth shut: people learn a lot better by experimenting and making small mistakes than by being schooled by their boss, and they often try to read into your passing remarks. Don't run an authoritarian camp focused on total risk aversion or perfectly efficient resource management; just set reasonable boundaries and exit conditions for experiments so that they don't spiral out of control - and be amazed by the results every now and then.


Death by planning


When nothing is on fire, it's easy to get preoccupied with maintaining the status quo. If your current headcount or budget request lists all the same projects as last year's, or if you ever find yourself ending an argument by deferring to a policy or a process document, it's probably a sign that you're getting complacent. In security, complacency usually ends in tears - and when it doesn't, it leads to burnout or boredom.


In my experience, your goal should be to develop a cadre of managers or tech leads capable of coming up with clever ideas, prioritizing them among themselves, and seeing them to completion without your day-to-day involvement. In your spare time, make it your mission to challenge them to stay ahead of the curve. Ask your vendor security lead how they'd streamline their work if they had a 40% jump in the number of vendors but no extra headcount; ask your product security folks what's the second line of defense or containment should your primary defenses fail. Help them get good ideas off the ground; set some mental success and failure criteria to be able to cut your losses if something does not pan out.


Of course, malfunctions happen even in the best-run teams; to spot trouble early on, instead of overzealous project tracking, I found it useful to encourage folks to run a data-driven org. I'd usually ask them to imagine that a brand new VP shows up in our office and, as his first order of business, asks "why do you have so many people here and how do I know they are doing the right things?". Not everything in security can be quantified, but hard data can validate many of your assumptions - and will alert you to unseen issues early on.


When focusing on data, it's important not to treat pie charts and spreadsheets as an art unto itself; if you run a security review process for your company, your CSAT scores are going to reach 100% if you just rubberstamp every launch request within ten minutes of receiving it. Make sure you're asking the right questions; instead of "how satisfied are you with our process", try "is your product better as a consequence of talking to us?"


Whenever things are not progressing as expected, it is a natural instinct to fall back to micromanagement, but it seldom truly cures the ill. It's probable that your team disagrees with your vision or its feasibility - and that you're either not listening to their feedback, or they don't think you'd care. It's good to assume that most of your employees are as smart or smarter than you; barking your orders at them more loudly or more frequently does not lead anyplace good. It's good to listen to them and either present new facts or work with them on a plan you can all get behind.


In some circumstances, all that's needed is honesty about the business trade-offs, so that your team feels like your "partner in crime", not a victim of circumstance. For example, we'd tell our folks that by not falling behind on basic, unglamorous work, we earn the trust of our VPs and SVPs - and that this translates into the independence and the resources we need to pursue more ambitious ideas without being told what to do; it's how we game the system, so to speak. Oh: leading by example is a pretty powerful tool at your disposal, too.


The human factor


I've come to appreciate that hiring decent folks who can get along with others is far more important than trying to recruit conference-circuit superstars. In fact, hiring superstars is a decidedly hit-and-miss affair: while certainly not a rule, there is a proportion of folks who put the maintenance of their celebrity status ahead of job responsibilities or the well-being of their peers.


For teams, one of the most powerful demotivators is a sense of unfairness and disempowerment. This is where tech-originating leaders can shine, because their teams usually feel that their bosses understand and can evaluate the merits of the work. But it also means you need to be decisive and actually solve problems for them, rather than just letting them vent. You will need to make unpopular decisions every now and then; in such cases, I think it's important to move quickly, rather than prolonging the uncertainty - but it's also important to sincerely listen to concerns, explain your reasoning, and be frank about the risks and trade-offs.


Whenever you see a clash of personalities on your team, you probably need to respond swiftly and decisively; being right should not justify being a bully. If you don't react to repeated scuffles, your best people will probably start looking for other opportunities: it's draining to put up with constant pie fights, no matter if the pies are thrown straight at you or if you just need to duck one every now and then.


More broadly, personality differences seem to be a much better predictor of conflict than any technical aspects underpinning a debate. As a boss, you need to identify such differences early on and come up with creative solutions. Sometimes, all you need is taking some badly-delivered but valid feedback and having a conversation with the other person, asking some questions that can help them reach the same conclusions without feeling that their worldview is under attack. Other times, the only path forward is making sure that some folks simply don't run into each for a while.


Finally, dealing with low performers is a notoriously hard but important part of the game. Especially within large companies, there is always the temptation to just let it slide: sideline a struggling person and wait for them to either get over their issues or leave. But this sends an awful message to the rest of the team; for better or worse, fairness is important to most. Simply firing the low performers is seldom the best solution, though; successful recovery cases are what sets great managers apart from the average ones.


Oh, one more thought: people in leadership roles have their allegiance divided between the company and the people who depend on them. The obligation to the company is more formal, but the impact you have on your team is longer-lasting and more intimate. When the obligations to the employer and to your team collide in some way, make sure you can make the right call; it might be one of the the most consequential decisions you'll ever make.